Solution Explorer Enhancement- Show on Code Map
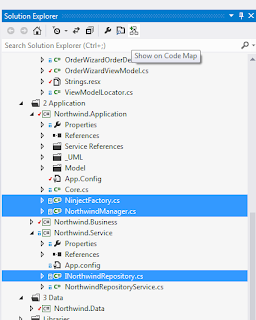
Visual Studio 2012 Solution explorer has been extended to enable the user to draw the code map based on the selection in solution explorer. As we know that Solution Explorer allows multiple selection, so we can select multiple files and hit Show on Code Map tool bar button in Solution explorer. Since Solution explorer allows us to navigate to classes and methods in a code file, we can even make more granular selection of methods and classes focusing on a particular area of code that we are interested in.

This option is specially useful when reviewing code for other team members. We can select all files committed by your mate and see their dependencies in the code map. Since solution explorer is an enhanced explorer in Visual Studio 2012, It allows us to select even individual classes in a file and their respective members including methods and properties.
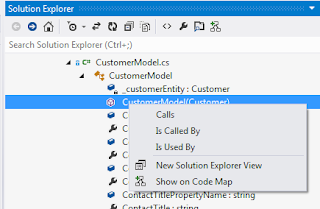
Solution explorer context menu has also been extended to include Show on Code Map item. The menu considers the context of the selected items and makes the menu items available based on the type of selection. If it is a class then it allows to look at the inheritance hierarchy of a class as discussed in earlier posts about solution explorer enhancements in Visual Studio 2012. For methods, it allows to see the call hierarchy and references of these methods. But for all these code items, Show on Code Map item is always available which can be selected to add item to a new or existing code map.
Create Graph from Architecture Explorer
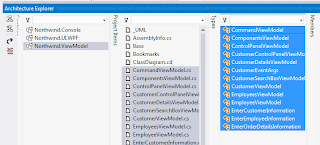
We can also create dependency graph on code map from architecture explorer. Architecture explorer allows us to navigate through the code to very deep level using the symbols without worrying about the actual code. We can create a new graph document or include the items in an already created graph document. The items are added to the graph using the new buttons shown in the architecture explorer available with Visual Studio 2012 Ultimate.
No Integration with Class View Explorer
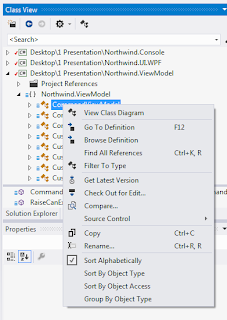
There is currently no integration of Code Map with Class View Explorer. As an example, let's look at the context menu shown for a class in Class View Explorer. There is no Show On Code Map that you might expect when you get used to it in Solution Explorer.
Code Map from Code Editor
Code editors also allow us to view the dependency of an item in code map. We can just right click an item and select Show on Code Map from the context menu. This is actually a Visual Studio 2012.1 enhancement.
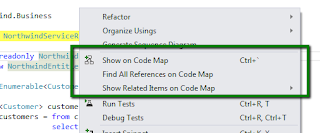
As we are going through the code we can keep adding the types, their members and containing assemblies on code map. The code map would keep adding them as nodes keeping the context of their containment relationship. This would also keep the dependencies between these nodes current.
Adding Graph Document To a Project
We can create dependency graph in two different ways. In the first approach we can create an empty graph document using Add New Item Dialog. This graph document is created in a project directly. When we save project then the item definition is also saved with the project. Saving all would save the graph and the project.
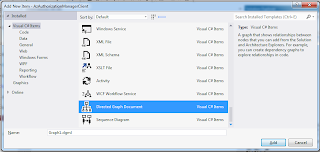
The other option is to keep adding items to the code map using Show On Code Map feature in various editors and tools in Visual Studio. The first time selection of this would create a new graph document with a default name if no graph has already been created. We can then move the graph document to a particular project by following the following menu:
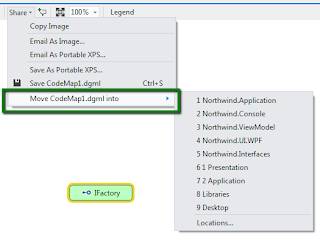
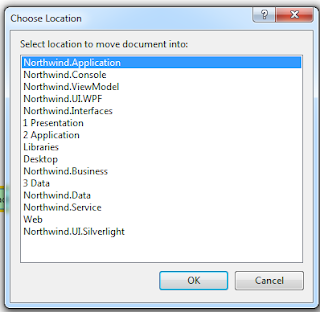
The above action would add the graph document to the top of project hierarchy. We can also create it in a sub folder within a project. You can notice the location menu above. Visual Studio first asks us to select the project where we need to add item then it opens file explorer to specify the location where the item would physically be saved.
Method Dependencies resolution In Code Map
Code map surface and editor allows various options to further explore deeper dependencies between items. The options are available as we select a node on the surface. Various context menu items are available based on the selected item. Here we have selected a method node, look at the various options available to explore dependencies of the selected method. Remember View Call Hierarchy tool discussed in previous posts? Now compare it to the sophisticated detailed options available here.
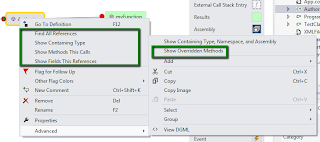
From the available options, we can select Show Methods This Calls. The selection would add additional nodes including the other methods called by the selected method.
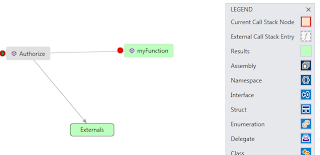
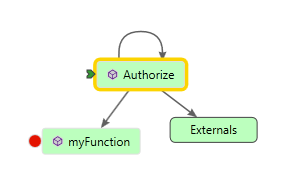
It can also show recursive calls . In the following method recursive call is displayed. Don't question me why would here be a recursive call. This is a bug which is highlighted for easier detection in this graphical format.

Type Dependencies Resolution In Code Map
This includes interface and concrete types. Code map supports showing the types in the inheritance hierarchy including base and derived classes, plus the interfaces that the type implements. We can also include the references of types referenced by / referencing this type. Code Map also supports to add the namespace and assembly that this type belongs to.
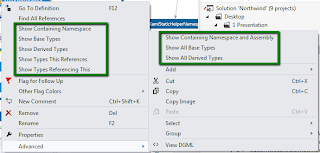
The same menu items are available in Show Related menu.

We can select to show base class. For a class, it will show the base class inherited and the implemented interfaces. In this example we have selected to show the base types of Authorizer class. It implements IAuthorizer class. Since all types implicitly inherit from System.Object, it is also shown in the graph.
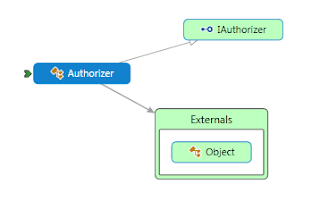
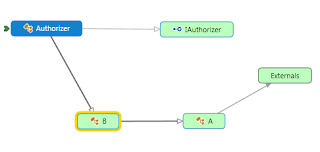
Show All Base Types shows all the types in the inheritance relationship all the way to System.Object. The opposite is Show All Derived Types, which shows all the types in the inheritance hierarchy.
Drag & Drop On Code Map Surface
Code Map also supports dragging items from Solution Explorer on a Graph. We can even select multiple items from solution explorer and drop it on the surface. They can even be different types i.e. we can select a combination of methods and types for such drag and drop. What we cannot do is the multiple selection of items from different project and drop all of them on a graph surface. Before you drop the items on graph surface, it shows you the number of items being dragged.

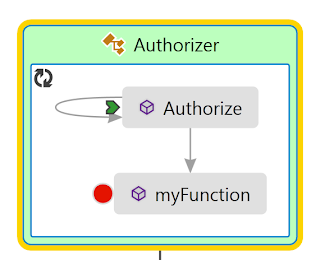
The items are merged with the items already existing on a graph. In the following, we already had Authorize method node on graph. Then we added its containing type Authorizer on the surface. Code map does the necessary merging showing the method as contained by the type and expands the class node to show the merging.
Go To Definition
Code Map support navigating to the code definition anytime we select the node. This navigation option can be selected from the context menu of a node for a type or its member. This is the same Go To Definition available from code editor and you might already be used to using F12 for going to definition for the item currently under the cursor. Just select a node and hit F12 to go the definition of the selected node.
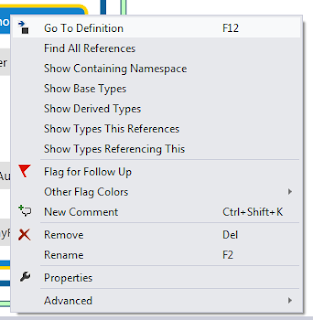
Strangely this option is also available for an Assembly node as well. When clicked, the context menu is just closed and no action happens. Ideally, I would expect this option not to be available in context menu items list as the context doesn't require so. I have submitted this as a bug on Connect, let's see what Visual Studio Platform team thinks about it. Just vote for it if you think that this option should be removed from here.



No comments:
Post a Comment