Visual Studio 2012 has a lot of very interesting feature. Code Map is one of them. This tool helps us in going through the call hierarchy analyzing the code base through caller / callee relationship. This also helps us going through the call stack in a graphical way. This is departure from the previous approach of Visual Studio which relied on providing a stack frames details in a list. While stepping in and out of the call stack in a complex code, it is very easy to lose track. In this post we are going to discuss how we can map the code flow using features available in Visual Studio 2012 excluding code map. In the next post, we are going to see how the same requirements are fulfilled by code map tool in Visual Studio. These are the tools which enables us to understand the code flow without actually running it.
Not The Code Map Extension
Please don't confuse this with another Visual Studio extension with the same name from AxTools. This extension allows us to view the way code is structured in a code file providing details about class members including methods, properties and events. The trial version of the extension is available in Visual Studio gallery. You can get it from Extensions and Updates option in Tools menu in Visual Studio.
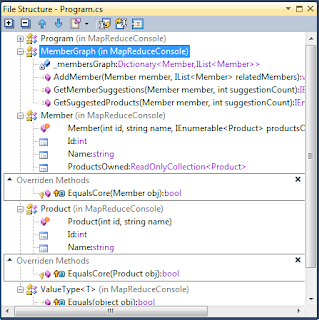
Resharper also has similar feature called Resharper File Structure. Hit Ctrl + F11 with Resharper keyboard scheme and you should see a similar tool window. You can dock it within Visual Studio real estate to the side or move it to another monitor.
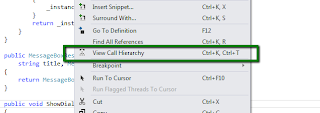
View Call Hierarchy
The best option available has been View Call Hierarchy. You can also find it in Visual Studio 2010. It lets you select a method and shows the calls In and Out of it. If this is a method, it also shows some details about how it is implemented by the implementing classes and the related code flows.
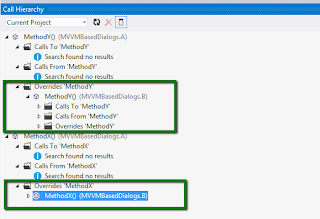
There are mainly two options available for this including Calls To and Calls From. You can follow the possible call hierarchy by just expanding the tree nodes. There are other options available based on the context of the method. Like for an interface methods, there wouldn't be any code called from the interface members but other code might abstract the calls using this interface member which can be shown in Calls To section. It should also show the types implementing the interface and how the selected member is implemented by the concrete implementations.

For the virutal and abstract members, it can show the types overriding the member. Here we have introduced two classes A and B. A is an abstract class with MethodX as an abstract member. It also has a virtual member with some default implementation. B is inheriting A overriding both these methods.
We can view the call hierarchy starting from A. As we select to view the call hierarchy for MethodX and MethodY, we individually select them from the code editor. Visual Studio IDE adds them to the same Call Hierarchy window.
We can certainly scope the hierarchy navigation to the opened documents. The other option is to limit it to the project or even to widen the scope to the whole solution. Just look at the following drop down in the call hierarchy.
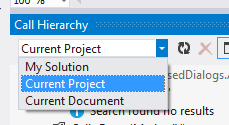
We can even see the call site where the member is actually referenced. This includes file name and line number of the code usage. Double clicking the call site should open and navigate to the specified code location.

VS2010 has the same feature but with more classical theme. Here I have added the call hierarchy for one of my test project.

Find All References
The other option is to select Find All References [Ctrl + R + T]. Just right click the member in the editor and select the following option:
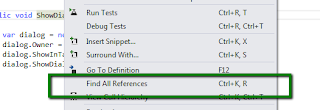
The list of references are shown in a tool window. It supports code navigation i.e. when we double click the individual item, the referenced code is opened in an editor in Visual Studio IDE.

Global Search
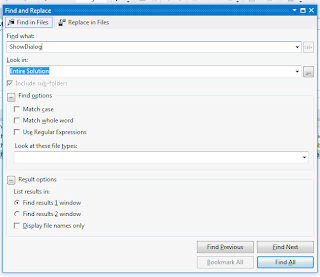
One option which always work for understanding the code flow is Global Search [Ctrl + Shift + F]. Identify the individual members in the code and try to see how and where they are referenced. There are references which are not possible to navigate at design time, they are only resolved at the time when the code is actually running. This is specially useful for such scenarios. But this gives so many entries that it is sometimes very difficult to navigate through the list.
Navigate To
Visual Studio 2010 introduced Navigate To feature. This allowed to search the symbols throughout the code. The symbol can be type name itself including interface and concrete types. They can also be members of these types including methods, properties and events as well. This provides the ability of incremental search. The view keeps updating as we type the search pattern. This also includes fuzzy search capabilities searching on more than one words at the same time. Hitting Ctrl + , should open the following dialog in Visual Studio. This feature is also available in Visual Studio 2012.
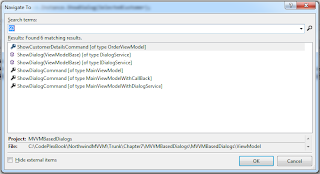
You can also open the dialog from the following menu:
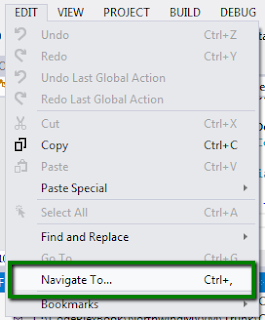
Enhanced Solution Explorer
If you have tried Productivity Power tools for Visual Studio 2010 then you might remember an enhanced solution navigation tool window, called Solution Navigator. It combined some of the features of Class View, Navigate To, View Call Hierarchy, all merged into Solution Explorer. It has been a break through code navigation tool from Visual Studio Platform team in Microsoft. Since the natural trend is to incorporate successful tools from Power tools to Visual Studio RTM, many of the features of Solution Navigator have become part of Solution Explorer in Visual Studio 2012. Additionally, Solution Navigator has been removed from Productivity Power tools for Visual Studio 2012. You can download the Productivity Power tools for Visual Studio 2012 [http://visualstudiogallery.msdn.microsoft.com/3a96a4dc-ba9c-4589-92c5-640e07332afd]. The latest update is released on 4th Apr, 2013.
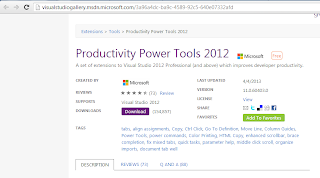
Please notice the solution explorer enhanced view in Visual Studio 2012.
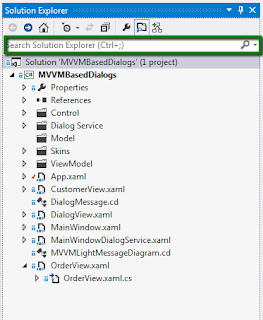
It supports the same fuzzy, incremental searching and search based on pascal casing as in Navigate To tools. Like Navigate To tool, the search includes all the symbols including file names. Please remember that this is not a text search in the documents in the solution.
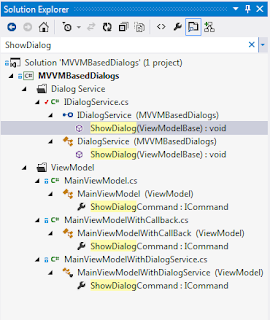
Like View Call Hierarchy window, it also supports seeing the possible call hierarchy and usage of a particular symbol. Here we have selected a property, the context menu of the property is displayed as follows:
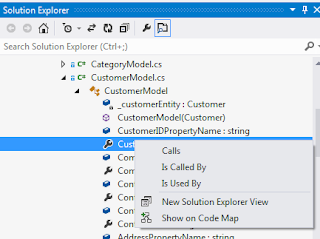
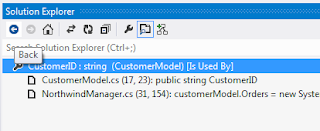
Selecting any of these options would navigate to a new solution explorer view displaying only the specified request regarding calls or usage of the symbol. We can always navigate back to a previous view.
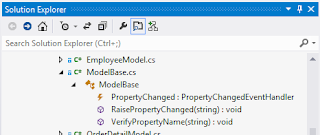
Borrowing the feature from class view, it shows the details of a class. It shows all the classes in a particular file which can be extended to see its members. But It doesn't show the inheritance details of a class unlike a class view.


No comments:
Post a Comment