If you don't know what I am talking about then just follow through this menu. Actual this option was made available for Data Tips in Visual Studio 2010. Looks familiar?? (If not, just follow this post)
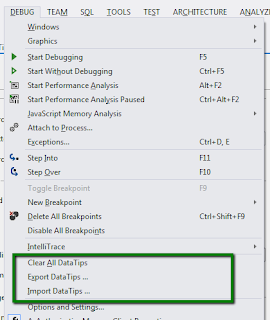
Data Tips Displayed
Data Tips are displayed when we hover over the cursor on a reference while debugging when a break point is hit. The reference should be in the current scope of execution. There is a littlel + (plus) sign with the reference in case it has nested members.
 [
[
It must be remembered that it would be showing the object assigned to reference in the current execution context. It would not show the value as it was when the line involving the data tip was executed.
Hitting Ctrl turns the data tip currently displayed nearly transparent. It becomes visible again as soon as it is released.

Data Tips & Visualizers
If there is a Visualizer loaded for the type of the reference for which the DataTips is displayed, then you should see the following icon in the Data Tip:

Since the type of policyUrl is string, Text Visualizer is displayed when we click on the icon. It would show the visualized view of the value. In this case, it is showing the text assigned to the string based reference as follows:
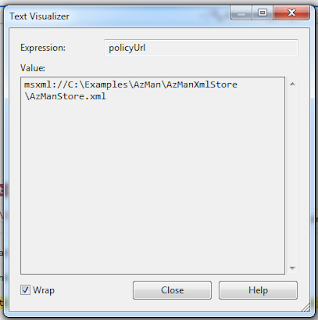
Clicking the drop down would let you select a different visualizer. We can even specify the default visualizer here, which would be used next time we click the visualizer icon.

Pinning Data Tips
Visual Studio 2010 introduced pinning of Data Tips. Please notice the following button on a Data Tip (when clicked this would pin it to the end of line). A pinned Data Tip can be dragged in the same document to an appropriate location.

The pins are displayed in the side bars where breakpoints and bookmarks are also displayed.

A pinned Data Tip can also be unpinned. Just click the UnPin button should do the job.

Unpinning a Data Tip turns it into a floating data tip. This is still shown on the display but with a different color. The floating data tip floats across the windows. This can be used to use data tips for members spanning across different files.

Clearing Data Tips
The data tips can be cleared for the current file. You can also clear all data tips from the debugging session.
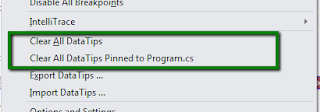
Comments With Data Tips
We can also add comments with the Data Tips. Here we are adding the comments to an already existing data tip. It is a multi-line comment.

These comments can also be collapsed. Hovering over the button shows the tooltip. Clicking on the button collapses the data tip.

Data Tips Not In Current Context
The data tips not in the current context are still displayed. They are displayed with a Refresh button with the following tool tip.

Importing / Exporting Data Tips
The data tips can also be exported. These exported data tips can be imported back into another debuggin session even on other machines. This is specially useful to share the data tips across the team. A developer can find something while debugging and creates data tips and puts the comments at the special places. The data tips can be exported and shared with the actual developer working on the bug fix.

Here is an example of a data tip exported from one of the test project used in one of our previous posts:
Please make sure that the other developers, you are sharing it with, also has the same folder structure for the code.
Add Expressions to Data Tips
We can add more expressions to a data tip. Just right click a data tipe, following context menu should be displayed which allows us to add / remove expressions from a data tip.
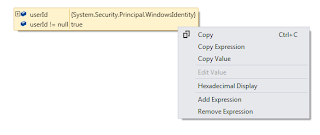
We can also copy the expression and also edit value if the data tip just has a variable reference as an expression.
Make Object Id
The data tips also support making object id. Just right click the data tip and the option is available.
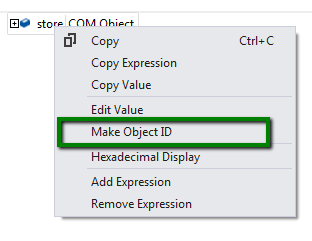
The Object Id can be used to observe these objects even when it is out of context. You can notice the numbered hash tag with the data tip. This is the Id created which can be used during the debugging session. Since for the new session a new object would be created so it would show that the object is not available for the next session when the same data tip is being used again.

Here we are using the same ObjectId out of the context. You can notice that it is out of context but Id is still working fine. It is used to follow up with the object during the debugging session for its life time. It is very handy to determine the memory issues with the application. The same Object Id can be used in other debugging windows including Watch window.

The same Object Id can be used in other debugging windows including Watch window.

The Object Id can also be deleted. Here we have right clicked the expression in the data tip involving the Object Id.
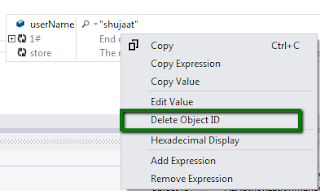
Deleting The Data Tips
Closing the Data tips deletes it. It would not be part of the exported xml after it is deleted.


2 comments:
Great post! But I am searching all over the Internet and cannot find the feature where data tip would be displayed when hovering the text cursor (with mouse cursor it works as expected) over the variable. I also use resharper but even there is no option or at least a shortcut to display the variable information without using mouse hover. Do you maybe have a solution?
Thanks, You can use Locals window during debug session.
Post a Comment